For operations managers, plant managers and supervisors
The hour-by-hour board, and how to get OEE from it
An hour-by-hour board records, for every hour of a shift, how many units were planned, how many good units were made, and why any hour fell short. A shift of those hours, plus the stop times, gives you OEE: availability × performance × quality.
Published by COPEX · Updated · About 8 minutes to read
What goes on an hour-by-hour board
One row per hour. These columns are enough for most areas:
- Hour: the time slot, for example 07:00 to 08:00.
- Plan: how many units this hour should produce, after any planned break in that hour.
- Actual: good units made this hour.
- Cumulative plan and actual: running totals since the start of the shift, so a slow morning cannot hide.
- Difference: actual minus plan, cumulative.
- Reason: in plain words, what took the hour off plan.
- Initials: who wrote it, so someone can be asked.
Many areas also note scrap, rework, downtime minutes and the backlog waiting in front of the area every hour. Those are the numbers OEE and lead time are built from.
An example board
Worked example
The first four hours of a day shift
A made-up plant with invented numbers, for teaching only.
Swipe the table sideways to see every column.
| Hour | Plan | Actual | Cum. plan | Cum. actual | Diff. | Reason |
|---|---|---|---|---|---|---|
| 06:00–07:00 | 50 | 50 | 50 | 50 | 0 | — |
| 07:00–08:00 | 50 | 38 | 100 | 88 | −12 | Feeder jam, stopped 10 min |
| 08:00–09:00 | 38 | 36 | 138 | 124 | −14 | 15-min break. 2 scrapped: wrong label |
| 09:00–10:00 | 50 | 47 | 188 | 171 | −17 | Waited 3 min for material |
By 10:00 the area is 17 units behind, and the board already says why: one stop, one quality problem and one material wait. The supervisor can act on the feeder before lunch instead of reading about it tomorrow.
From the board to OEE
OEE (overall equipment effectiveness) is three ratios multiplied together. Each one isolates a different kind of loss.
- Planned production time
- Shift time − planned stops (breaks, planned meetings)
- Run time
- Planned production time − downtime
- Availability
- Run time ÷ planned production time
- Performance
- (Ideal cycle time × total units) ÷ run time
- Quality
- Good units ÷ total units
- OEE
- Availability × performance × quality
The ideal cycle time is the fastest the process can make one unit under ideal conditions, not a slower standard that already allows for losses.
An example, worked through
Worked example
One 8-hour shift
A made-up plant with invented numbers, for teaching only.
| Step | Calculation | Result |
|---|---|---|
| Planned production time | 480 min shift − 30 min of breaks | 450 min |
| Run time | 450 − 30 min of downtime | 420 min |
| Availability | 420 ÷ 450 | 93.3% |
| Performance | (1.0 min ideal cycle × 360 units) ÷ 420 | 85.7% |
| Quality | 342 good ÷ 360 total | 95.0% |
| OEE | 93.3% × 85.7% × 95.0% | 76.0% |
A quick check: good units × ideal cycle time ÷ planned production time = 342 × 1.0 ÷ 450 = 76.0%. The same answer means the inputs agree.
The biggest loss here is performance: in 420 minutes of running, 360 units took only 360 minutes of ideal time, so 60 minutes went to slow running or short stops nobody wrote down. Downtime cost 30 minutes and scrap 18 minutes. Performance is where to look first.
What OEE tells you, and what it does not
Look at the three parts, not only the total
Low availability points to breakdowns, waiting and long changeovers. Low performance points to small stops and slow running. Low quality points to scrap and rework. The total says how much is lost; the parts say where.
Start with the constraint
The area that limits the whole flow sets the output of the value stream. An hour lost there is lost for everyone, so its OEE matters more than any average.
Do not average percentages across machines
Two machines at different speeds cannot be averaged as plain percentages. Add up the underlying times and units first, then calculate.
Common mistakes
Filling the board at the end of the shift
By then the reasons are guesses. Write each hour as it closes.
Reasons like “misc.” or “issues”
A reason must say what happened, so someone can act on it.
Using a padded cycle time
A standard that already allows for losses makes performance look better than it is. Use the ideal cycle time.
Counting rework as good
Quality is first-time good units only. Otherwise the hidden rework never shows.
Calling unplanned stops “planned”
Moving breakdowns into planned time raises availability on paper and hides the loss.
In MyGemba AI
See Where Your Flow Loses Time
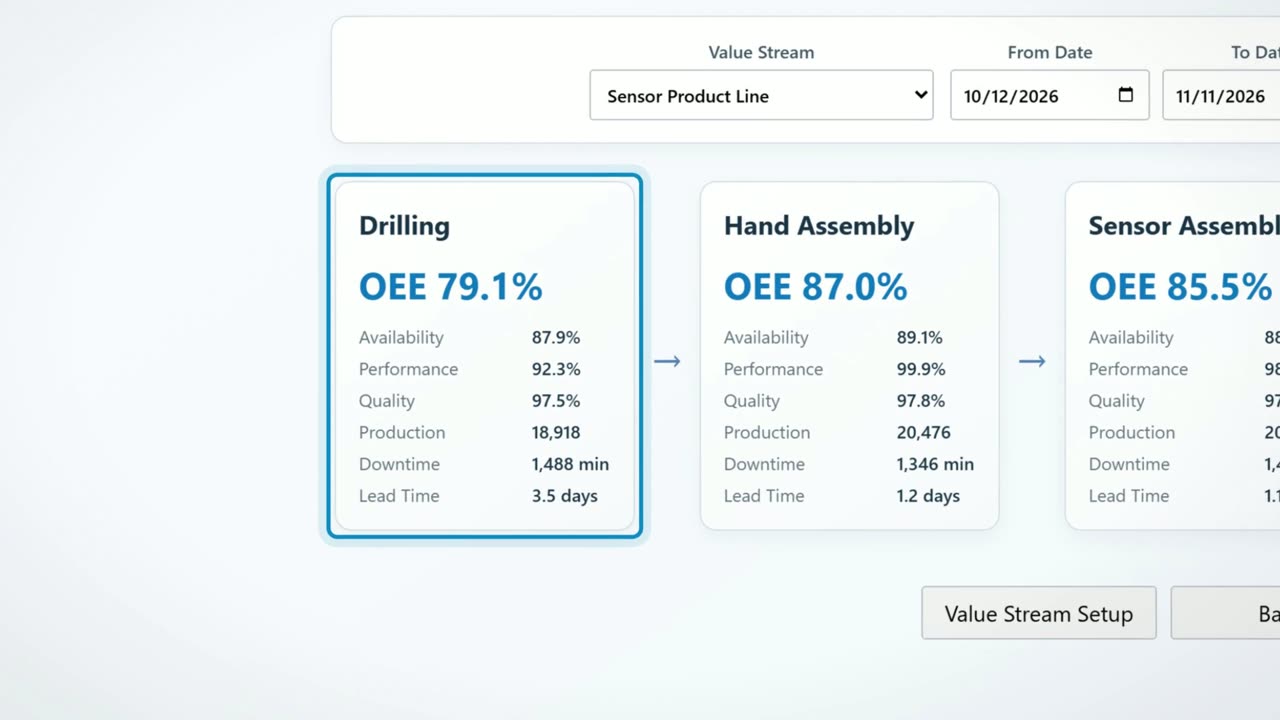
In MyGemba AI, the hour-by-hour board is Day Performance, inside the Value Stream module, and the same hourly records give OEE for each process area.
The data step between your strategy and your improvement work. Every hour, each process area records production, MRB, rework, scrap, downtime and backlog.
- Day Performance: the hour-by-hour board
- Overall Performance: OEE as availability, performance and quality
- VS Management: process areas in flow order, sortable by worst lead time
Value Stream comes with the OpEx Leader Certification, the full MyGemba AI system: all eight modules and all six certifications.
14-day money-back guarantee · Cancel anytime
Opens the MyGemba AI page on the Value Stream film and its offer.
Tom Dunn, Creator of MyGemba AI, is a Lean Six Sigma Master Black Belt with 45 years of continuous improvement experience. Every plan comes with the Master Black Belt Level AI Coach.
Questions
What is a good OEE score?
About 85% is often quoted as world class for discrete manufacturing. Treat it as a reference, not a target for every machine: what matters is the trend on your own constraint, and which of the three losses is the biggest.
Should reworked parts count as good in OEE?
No. Quality counts only units that were right the first time. A reworked unit used machine time to be made twice, so counting it as good hides a real loss.
Is a changeover planned downtime?
Practice differs. Many teams count changeovers as availability loss, because changeover time can be reduced and they want to see it. Whatever you choose, write the rule down and apply it the same way on every line, or the numbers cannot be compared.
Who should fill in the hour-by-hour board?
The operator or team leader at the area, at the end of each hour, while the reason for any gap is still fresh. The supervisor reads it during the shift and responds to the gaps; the board is for acting the same day, not for reporting afterwards.
Before the board: the strategy it serves. See how to fill out a Hoshin Kanri X-matrix. After it: building the daily habit of improving what the board shows, with the Toyota Kata coaching questions.