BUILD YOUR FIRST DIGITAL VALUE STREAM
Stop drawing value streams. Start managing them.
Bring one real value stream from your plant. In 2 live working hours with Tom Dunn and Victor Pazmiño, configure your process flow, upload your actual operational data, and leave with a working digital operating system inside MyGemba.
$499 Per Company (Multiple participants welcome)
Strictly 5 Companies (Hands-on data modeling)
12 Months MyGemba VSM + MyToolbox Included
2-Hour Live Working Session (Online)
Your Value Stream Map should not end as a PowerPoint slide.
Most plants know how to draw a map. The harder question is: can you use that map to run the shift?
- •Trapped in PowerPoint, Excel, or rolled-up plotter paper.
- •Disconnected from daily shift-by-shift numbers.
- •An expired historical snapshot that blinds leadership to live WIP queues.
- •Models actual multi-stage line velocity and WIP buffers.
- •Connects directly to hourly production, downtime, scrap, and rework.
- •Real-time visibility into mathematical OEE, Availability, and Quality loss.
In 2 Hours, Build Something Real.
You do not leave with another slide deck. You leave with your actual value stream running digitally.
Select Your Value Stream
Choose one real, critical manufacturing line or business process. Focus on the product family with the highest variance or delivery pressure.
Configure the Flow
Model and sequence your process areas to reflect actual material velocity and shopfloor pacing inside MyGemba.
Ingest Operational Data
Bring your Excel/CSV numbers: production, downtime minutes, scrap, rework, and MRB mapped directly into shift boards.
Isolate Hidden Loss
Instantly evaluate mathematical OEE, downtime Pareto distributions, and lead-time constraints.
From Process Flow to Operational Performance
Built by Lean Six Sigma Master Black Belt Tom Dunn out of 45 years of practical manufacturing leadership, MyGemba transforms static value stream maps into a live, interconnected OpEx operating architecture.
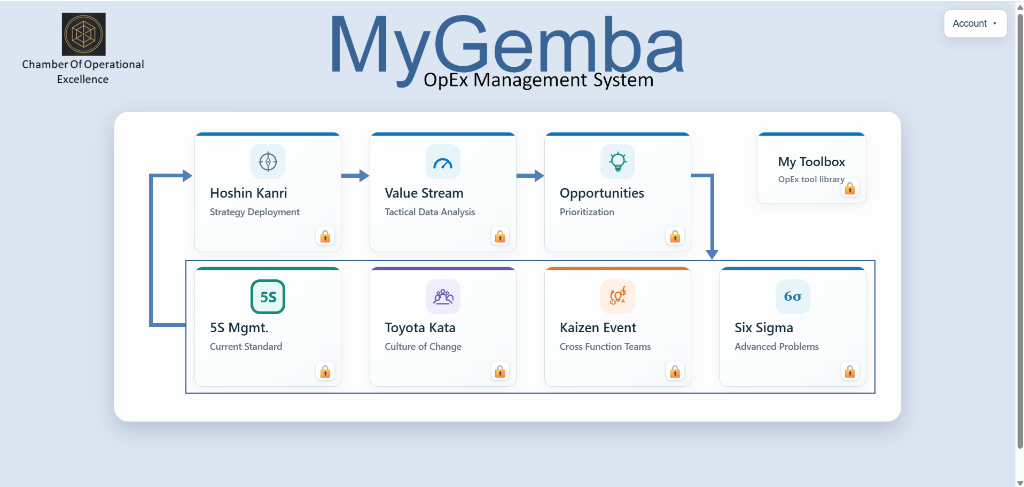
An Interconnected OpEx Management Suite
The Digital VSM is not an isolated diagram—it is the central operational engine inside MyGemba. Strategy cascades through Hoshin Kanri, flows through Value Stream tactical analysis, routes into the Opportunity Hopper, and deploys directly into 5S, Toyota Kata, Kaizen Events, or Six Sigma projects.
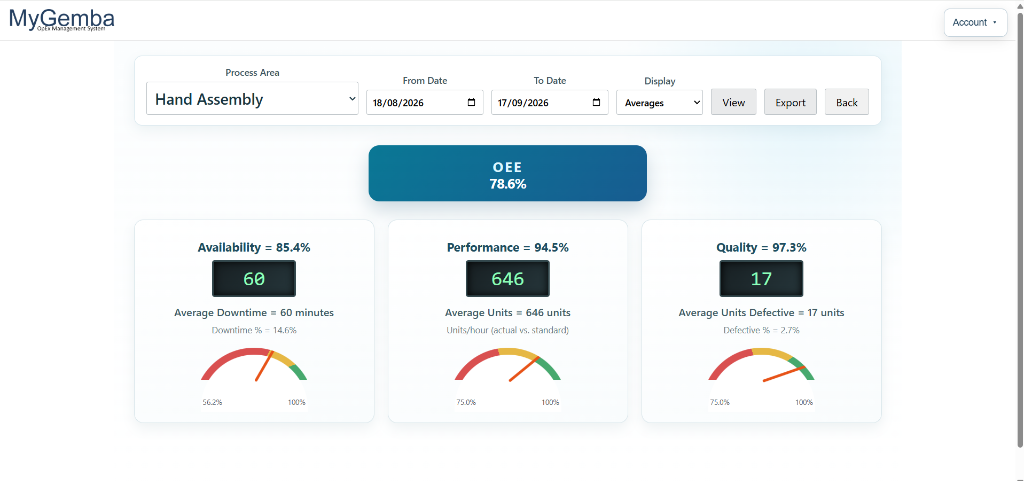
Mathematical OEE Control
Performance calculations are standardized across every cell so hidden availability and scrap losses cannot hide in aggregate reports.Availability (85.4%) × Performance (94.5%) × Quality (97.3%) = OEE (78.6%)
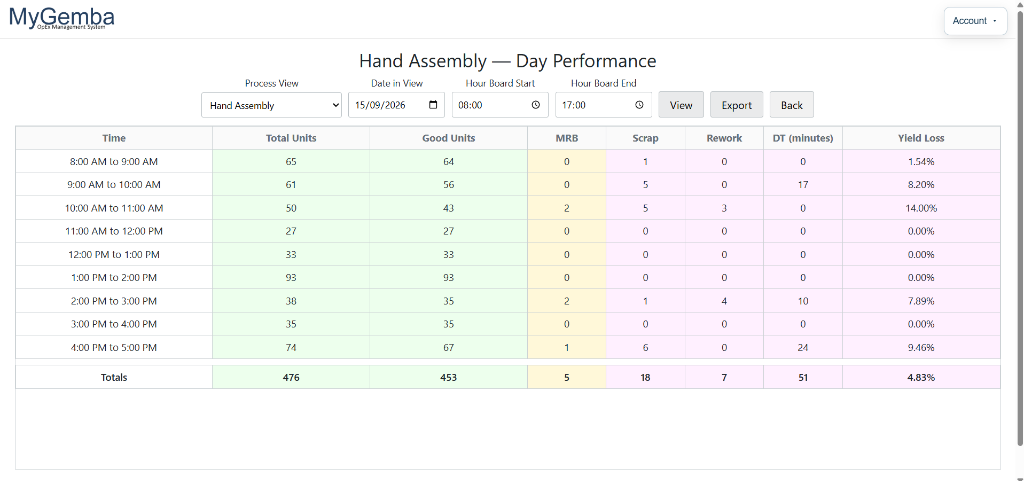
The Hourly Pacemaker (Day Performance)
Spot and contain abnormalities in 60 minutes instead of waiting for end-of-month post-mortems. 8:00 AM – 5:00 PM shift log tracking units, scrap, MRB, downtime, and yield loss (1.54% to 14.00%).
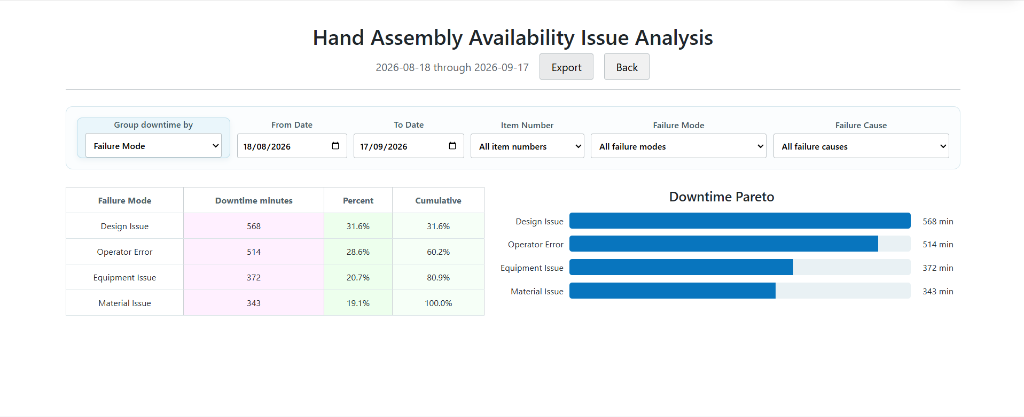
Downtime Pareto Prioritization
Target the vital 20% root causes using disciplined countermeasure cadences instead of wasting engineering hours on minor incidental disruptions.
Why Operations Shift to Digital VSM
Moving beyond static documentation to build an active, automated control layer across your plant floor.
Dynamic Lead-Time Modeling
Automatically calculates available minutes vs. good output to forecast real lead times instead of relying on static guesses.
Instant Bottleneck & Buffer Exposure
Visually flags WIP accumulation and pacing discrepancies across cell handoffs before they create schedule latency.
Elimination of Static Artifacts
Replaces forgotten slide decks and whiteboards with a live operational screen tied directly to daily shift numbers.
Mathematical Multi-Cell Alignment
Connects individual cell OEE directly to aggregate enterprise throughput, ensuring line improvements reach the P&L.
Shift-to-Shift Variance Visibility
Exposes whether line performance drops by shift, operator group, or process area with 60-minute resolution.
Auditable Single Source of Truth
Eliminates departmental discrepancies between ERP work orders, whiteboard pitch charts, and monthly engineering spreadsheets.
MyToolbox: Over 35 Built-in Lean & Minitab Alternatives
Stop paying for expensive desktop statistical licenses or wrestling with broken spreadsheets. Every company receives 12 months of full access to MyToolbox.
What Happens During the 2 Hours?
A disciplined, hands-on working agenda designed to build and verify your digital value stream in real time.
The Structural Flaws of Static VSM
Why traditional maps fail to sustain flow. Transitioning from historical documentation into an active, living operating architecture.
Configuring Your Value Stream
Setting up process areas, cycle standards, and planned hours inside MyGemba to mirror your actual shopfloor layout.
Ingesting Company Data
Uploading CSV or shift inputs: production counts, downtime minutes, scrap, rework, and MRB into Day Performance boards.
Analyzing OEE & Downtime Pareto
Isolating bottlenecks, yield loss, and lead-time constraints using mathematical Availability, Performance, and Quality tracking.
Institutionalizing the Living Cadence
Daily review rhythms and continuous governance to ensure your digital operating cadence sustains post-workshop.
45 Years of Practical Shopfloor Experience
Direct working access with the architect and operational practitioners behind MyGemba.
Tom Dunn
Senior Lean Six Sigma Master Black Belt • 45+ Years Experience
Architect of the MyGemba Management System. Built MyGemba to codify four decades of plant leadership into a living operational engine.
Victor Pazmiño
Lean Six Sigma Black Belt • 11 Years with Tom Dunn
Specializes in executing daily cadences, standard work architectures, and digital Gemba tools alongside Tom Dunn.